
August in review
- The August 2024 Consumer Sentiment Index by the University of Michigan reflects continued concern. At 67.9 points, Americans remain far below the neutral sentiment index reading of 100.
- Consumers continue to point to impact of high prices and perceive substantial uncertainty in the trajectory of the economy, per the August findings.
- USDA’s Economic Research Service released the 2023 Food Security numbers. In 2023, 13.5% of households were food insecure at least some time during the year. Per the ERS, this is a statistically significant increase from the 12.8% in 2022.
- This concern has resulted in fewer restaurant visits and a greater share of food dollars flowing into retail in recent months. When shopping for groceries, consumers also apply a wide range of money-saving measures.
- While consumers are focused on price and promotions, it is rarely the only consideration going into the purchase. There are no linear consumer purchase patterns, which makes the marketplace complex but also ripe with opportunities for growth when addressing consumers’ daily puzzle between budget, time, health and more.
- Value-added and deli-prepared sales are strengthening, reflecting a continued need for convenient solutions, while younger shoppers in particular continue to drive the importance of sustainable choices. Limiting food waste has become a very popular financial measure in addition to having environmental and social implications.
- August also reflected back-to-school for states across the nation, which signals big changes for many departments around the store. Lunchbox convenience and time-saving solutions for breakfast and dinner become of greater importance.
Inflation insights
In August 2024 (the five weeks ending 9/1/2024), the price per unit across all foods and beverages in the Circana MULO+ universe stood at $4.23, an increase of 1.6% versus August 2023. This is higher than the 1.5% price year-over-year increase seen in July as well as the first quarter averages of +1.2%. Prices in the fresh perimeter were up 2.6% year-over-year in August versus 1.1% in the center of the store. The average price of $4.23 is 35.1% higher than the 2019, pre-pandemic average of $3.13.
The average price per pound in the meat department across all cuts and kinds, both fixed and random weight, stood at $4.78 in August 2024, up 3.2% year-on-year. The average processed meat price stayed above $5, up 1.2% versus prior-year levels.

August brought a mix of price movements. Pork, beef and bacon, in particular, experienced increases in price. Lamb, turkey, packaged lunchmeat, smoked ham and processed chicken experienced price declines.

Meat sales
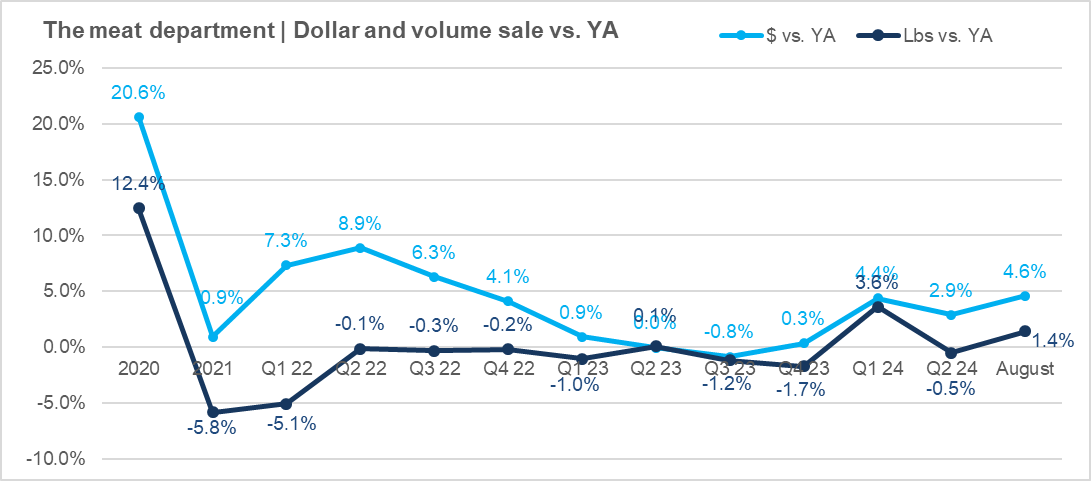
August was a very strong month for the meat department, especially on the fresh meat side. The five August weeks generated $10.1 billion, which was up 4.6% over August 2023, with pound gains of 1.4%.
In the 52-week view, dollars now trend 3.2% ahead of last year. This increase reflects a combination of mild price increases and pound gains of 1.0%. Pound growth is driven by strong everyday and holiday demand for meat and poultry as the world has turned home-centric once more.

Three out of the five August weeks experienced volume growth in comparison to year-ago levels. The three middle August weeks are free of the impact of any national or major holidays, showing the strength of everyday demand. All August weeks had about the same sales, at around $2.0 billion.
With August delivering another strong performance, the year-to-date meat department sales reached $69 billion, which reflects an increase of 4.2%. Year-to-date pound sales reached 15 billion, which is up 1.8% over the same period last year.
 Assortment
Meat department assortment, measured in the number of weekly items per store, averaged 425 SKUs in August 2024 — holding steady around 50 items below pre-pandemic levels.

Fresh meat Salses by protein
The big two, beef and chicken, had strong pound and dollar sales, but smaller proteins, including turkey and lamb also experienced robust gains in pound sales. For beef, the rise in pounds in combination with continued inflation led to an increase of 9.5% in August dollar sales compared to August 2023. Lamb’s 15.9% increase in dollar sales year-on-year is the result of a substantial increase in pound sales (+27.1%) combined with deflation of 8.8%.

Processed meat
Processed meat struggled a bit in August. Dollar sales decreased 0.6% over August 2023 and pound sales declined by 1.8%. While dinner and breakfast sausage, smoked ham and processed chicken experienced an increase in pound sales year-on-year, the declines in packaged lunchmeat and frankfurters pulled down the overall performance for processed meat.

Grinds
Ground beef had another enormous month, with $1.5 billion in sales during the five August weeks. This was an increase of 7.8% in dollars and 2.5% in pounds versus August 2023. Ground turkey and chicken sales also improved, whereas ground lamb and veal sales struggled. Monthly ground veal sales have fallen below $1 million.

What’s next?
- Grilling sets are making way for the fall merchandising lineup. Between back-to-school and the change in weather, daily and weekend routines are changing often leading to different meal routines as well. About half of emails are a combination of items cooked from scratch with items that are semi- or fully-prepared, with a growing role for the deli-prepared foods department.
- Consumers continue to make more trips to the grocery store than they have in years. The key to sales success is capitalizing on these additional visits by optimizing trips to the meat department. Additionally, cross-merchandising and secondary displays help improve trip conversion for meat and poultry.
The next performance report in the Circana, 210 Analytics and Hillphoenix series will be released mid-October to cover the September sales trends.
Date ranges:
2023: 52 weeks ending 12/31/2023
Q1 2024: 13 weeks ending 3/31/ 2024
Q2 2024: 13 weeks ending 6/30/2024
August 2024: 5 weeks ending 9/1/2024


