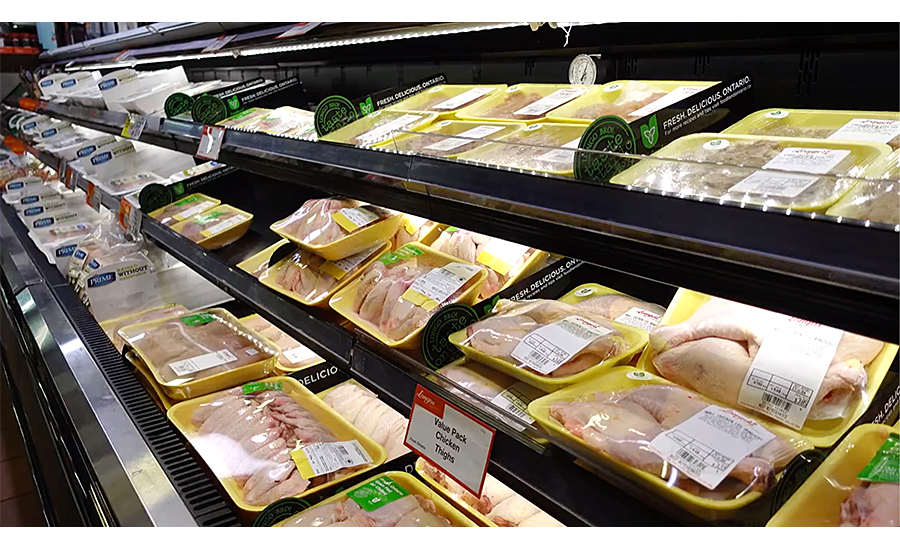
Fresh meat posts strong performance at retail in August 2023
Share of consumers who believe the cost of groceries is higher than last year dropped below the 90% mark for the first time in many months.

August’s summer weather, time off and travel boosted restaurant dining. According to the Circana (formerly IRI) monthly consumer surveys with primary grocery shoppers, the share of all meals that was prepared at home averaged 76.8% in August 2023. This share typically drops during the summer months, but 76.8% marks a multi-year low. At the same time, restaurants saw strong engagement with on-premise dining (53% of consumers), takeout (50%) and delivery (20%).
Mirroring the moderated rate of inflation and the more positive consumer confidence numbers by the University of Michigan, consumer price perceptions were more optimistic. At 87%, the share of consumers who believes that the cost of groceries is higher than last year dropped below the 90% mark for the first time in many months. However, concern about the ability to afford to groceries has (not yet) notably changed. 94% of Americans are worried about the cost of food and beverages amid rising gasoline and other costs. Additionally, more occasions flowing to restaurants added to the impact of the ongoing money-saving measures taken when in-store, which meant continued declines in units and volume for many categories around the store.
Other noteworthy findings from Circana’s August survey of 1,000+ primary grocery shoppers were as follows.
- Preventing at-home food waste has been the biggest change in meal preparation tactics in reaction to the ongoing high cost of food. This is closely followed by doing more with leftovers and using more simple ingredients.
- Consumer curiosity is somewhat subdued with only 16% browsing the aisles looking for new items to try. Routine meals help prevent buyer’s remorse over dollars spent on an unfavorable meal or item.
- Shopping remains in-store centric with only 5% of consumers buying all groceries online. Yet, another 31% will purchase a little/some (21%) or most items (10%) online — signaling an ongoing need for omni-channel excellence.
- A consumer deep-dive into frozen foods shows the fluency of today’s meal consumption — signaling big opportunities in added consumption occasions by addressing less common meal applications. For instance, buyers of frozen breakfast food (sandwiches, waffles, egg substitutes, etc.) revealed that only 43% consume them in the early morning hours. Instead, 39% eat them mid-morning, 16% at their lunch hour and 28% mid-afternoon or with dinner.
Life’s conflicting choices result in consumers continuing to shift their dollars across items, brands, sizes, stores and restaurants. Circana and 210 Analytics take a deep dive into the numbers to understand the marketplace impact on meat and poultry trends. The July report is made possible by Hillphoenix.
Inflation insights
The price per unit across all foods and beverages in the Circana-measured multi-outlet stores, including supermarkets, club, mass, supercenter, drug and military, increased by 3.6% in August (the five weeks ending 9/3/2023). While more in line with pre-pandemic inflation levels, the ongoing high levels of consumer concern relate to the cumulative effect of many months of high inflation. When comparing August 2023 to August 2020, prices have increased by 25.2%.

The average price per pound in the meat department across all cuts and kinds, both fixed and random weight, stood at $4.63 in August 2023, which was virtually unchanged from the levels seen in August 2022. Processed meat tends to have the higher prices, but its average price per pound continued to come down in August, primarily driven by bacon and sausage.

Chicken prices at retail continued to be more favorable for the consumer, at an average price per pound of $2.99. This was down 5.4% versus August of 2022. August was the first month in which turkey prices also came down year-on-year, whereas the renewed inflation in beef continued. The average retail price of beef increased by 5.7% per pound after several months of deflation. Deflation did persist for bacon and sausage.

Meat sales
In August 2023, flat prices in combination with fewer pound sold than last year resulted in meat dollar sales being down 1.5% year-on-year. On an annual basis, meat sales still tracked 0.5% ahead in dollars. Additionally, the 1.2% decline in pounds seen in August was better-than-average when compared to many other commodities and departments around the store.

Volume was trending closer to year ago levels until the fourth quarter of 2022, but recovery stalled come 2023. Pounds sales trended between 2% and 3% behind the prior year levels for the first six months of the year and moved within 1.2% in August despite a holiday-related boost and stronger restaurant engagement. Because of inflationary conditions having turned into deflationary or flat prices, the dollar and volume lines are starting to trend close together.

Assortment
Assortment, measured in the number of weekly items per store averaged 490 meat and poultry SKUs in August 2023. This was down 0.5% compared to the assortment in August 2022.

Fresh meat sales by protein
Fresh meat pounds were very close to year-ago levels in August 2023, as were the dollars. This was driven by a strong performance in chicken as well as turkey and fresh exotic, which includes bison. In the 52-week view, chicken was the only protein that increased pound sales. The renewed inflation in beef has resulted in rising pressure on pound sales, though ground beef is an important exception, as seen later.

Processed meat
August 2023 processed meat sales were about half that of fresh meat, at $2.7 billion. Dollar sales were down by 4.0% versus August 2022, while pounds decreased 2.8%. In the 52-week view, dollar sales remained flat versus year-ago levels overall despite some struggles for packaged lunchmeat and processed chicken.

Grinds
Bucking the trends seen in other areas of beef, ground beef pounds were flat and dollars increased 5.8% in August. Additionally, ground chicken, turkey and lamb gained in pounds in August as grinds bring affordability and versatility to the meat department.

What’s next?
Without any holiday-related sales boost and a strong month for restaurants, sales trends in the meat department are promising. Inflationary patterns are a dominant driver of sales trends, but opportunity persists in recreating restaurant meals and cooking basics.
The next performance report in the Circana, 210 Analytics and Hillphoenix series will be released mid-October 2023 to cover the September sales trends. To learn more about Circana’s meat and poultry sales and shopper measurements, please contact: FreshFoods@circana.com. Please thank the entire meat and poultry industry, from farm to store, for all they do.
Date ranges
Q2 2023: 13 weeks ending 7/2/2023
July 2023: 4 weeks ending 7/30/2023
August 2023: 5 weeks ending 9/3/2023
Looking for a reprint of this article?
From high-res PDFs to custom plaques, order your copy today!


