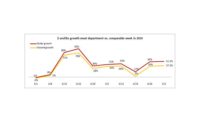
Hot dog sales jump to highest gains since early April

Since the second week of March, American households have taken to hot dogs as a convenient and kid-friendly solution with many more at-home meal occasions. The week ending April 26 marked the eighth week of multi-digit year-over-year sales gains for hot dogs. Dollar sales increased 42% and volume sales increased 25% over the week of April 26 versus the comparable week in 2019, according to IRI. This is the largest gap between volume and dollar sales since the onset of coronavirus in the U.S. National brands make up 97% of total hot dog sales and grew dollar sales 42%.
Type
Beef hot dogs represented nearly 63% of total hot dog sales and grew the most, at +52%. The prolonged duration of the double- and triple-digit increases, particularly during Easter week, and going up against Easter 2019 sales, points to a much higher everyday demand following the initial stock-up purchases.
|
|
Hot dog sales by week ending versus the comparable week in 2019 |
|||||||
|
|
03-08-20 |
03-15-20 |
03-22-20 |
03-29-20 |
04-05-20 |
04-12-20 |
04-19-20 |
04-26-20 |
|
Beef |
+14% |
+134% |
+136% |
+52% |
+59% |
+42% |
+36% |
+52% |
|
Non-beef |
+10% |
+106% |
+114% |
+33% |
+37% |
+24% |
+18% |
+26% |
Source: IRI, MULO, 1 week $ growth versus year ago
The surge in sales numbers shows shoppers are in the market for all pack sizes, large and small. The most common pack size is eight hot dogs, representing 51% of all sales, which explains the somewhat lower growth rate. Larger pack sizes of 10 and 24 counts have been doing very well these past few weeks, once more pointing to an increased everyday demand.
|
|
Hot dog sales by week ending versus the comparable week in 2019 |
|||||||
|
|
03-08-20 |
03-15-20 |
03-22-20 |
03-29-20 |
04-05-20 |
04-12-20 |
04-19-20 |
04-26-20 |
|
8 count |
+5% |
+109% |
+119% |
+37% |
+42% |
+31% |
+26% |
+35% |
|
10 count |
+15% |
+113% |
+132% |
+54% |
+58% |
+37% |
+37% |
+59% |
|
6 count |
+17% |
+173% |
+112% |
+46% |
+60% |
+30% |
+47% |
+38% |
|
24 count |
+13% |
+118% |
+124% |
+51% |
+60% |
+42% |
+51% |
+49% |
Source: IRI, MULO, 1 week $ growth versus year ago
Deli Meat
Random weight deli meat sales rebounded from their flat week when going up against Easter 2019. Sales were up nearly 16.9% in dollars and 11.6% in volume. Patterns relative to grab-and-go versus bulk counter sales remained the same as seen in prior weeks. While service counter sales made up 68% of deli meat sales this week, sales were down 4.7%. Sales for service counter deli meat that has been previously sliced for grab-and-go, but still sold non-UPC, was up 80.0%. But not everyone is a fan of this solution, as seen on Retail Feedback Group’s Constant Customer Feedback. “We had to go to another store for lunch meat and meats as you can only buy prepackaged. Not the brands we want, nor the amounts needed. You can socially distance at the counter even if it means order, shop and pick up. We will be going to another store until this is resolved.” Customer comments on package size variety for the reasons of budget, household size and variety also continued to come in on CCF. Meanwhile, pre-packaged, UPC-ed refrigerated luncheon meats continued to outperform random weight deli meat with dollars up 24.6% and a higher increase for volume sales as well. However, the difference compare with prior weeks was much diminished.
Source: 210 Analytics/IRI
Looking for a reprint of this article?
From high-res PDFs to custom plaques, order your copy today!


